
What does operational complexity look like?
Operational Intelligence Weekly Letter #3 | 8/31/20

If you’re reading this and you’re not a subscriber, please consider subscribing for the latest trends, analysis and commentary on how data, analytics and modern business intersect. We send this out once a week on Mondays.
I’m often asked to describe ways that companies are operationally complex. Marketplaces are typically a great example of complexity and companies like Walmart and Lyft have written about the technologies they use to tackle high volume data, but there isn’t always a focus on the business use case.
I was excited to see a post last week from Emily Hawkins at Drizly describing their analytics evolution and how they’re tackling analytics challenges at the liquor marketplace.
As Emily describes it, Drizly has four main areas where they started to get a more granular understanding of data at the store level:
Availability: The area the store covers, the hours and days of week stores are open
Capacity: The store’s ability to service an incremental order, how many drivers they had available, if they could legally use third party delivery drivers (Doordash, Postmates)
Selection: The store’s inventory, if they had the items customers are looking for
Price: The store’s item prices, if they were competitive in their market
Here’s a breakdown of one of these key drivers and how Drizly viewed Availability/Coverage:
Our first metric, the number of available stores per session, tried to answer the question, where should Drizly add new stores? Where were potential customers not able to access Drizly at all? Where would adding a new retailer to our network have the most impact? This was the first step in our journey of evaluating the value of a retailer, as well as helping our sales team prioritize outreach to get these valuable stores online.
The post goes on to detail the key business questions and related metrics that Emily and her team used to help drive Drizly’s marketplace business forward. If there’s anything I would like to see more of (maybe in a Part 2!) is which teams outside of analytics leveraged this work and how it fits into their workflow. Specifically it’d be great to see how the teams go from reporting on metrics to understanding why metrics are changing and then taking action.
Interesting Articles
The rise of dbt prompts innovation
This isn’t one article, but rather three examples of new tools either embracing or competing with dbt.
As a refresher, dbt is an open source project that aims to make it much easier for data analysts to transform data within data warehouses like Snowflake, BigQuery or Redshift.
Last week we saw three announcements/product releases related to dbt or the problems it solves:
Census released their dbt integration which is a pretty slick looking visual UI enabling companies to port their dbt models over to tools like Salesforce and Marketo.
A new tool called Structure was released that aims to be a competitor to dbt by making it easy to create data models visually.
A dbt community member created a plugin for VSCode to enable visual editing and manipulation of dbt models.
Clearly the dbt ecosystem is extremely vibrant and it’s exciting to see the pace of development there.
Tweet of the Week
Jay Kreps goes through a description of their roadmap at Confluent and how they’re working towards a true cloud native offering in a similar vein to Snowflake or BigQuery. This should accelerate the adoption of event-driven use cases.
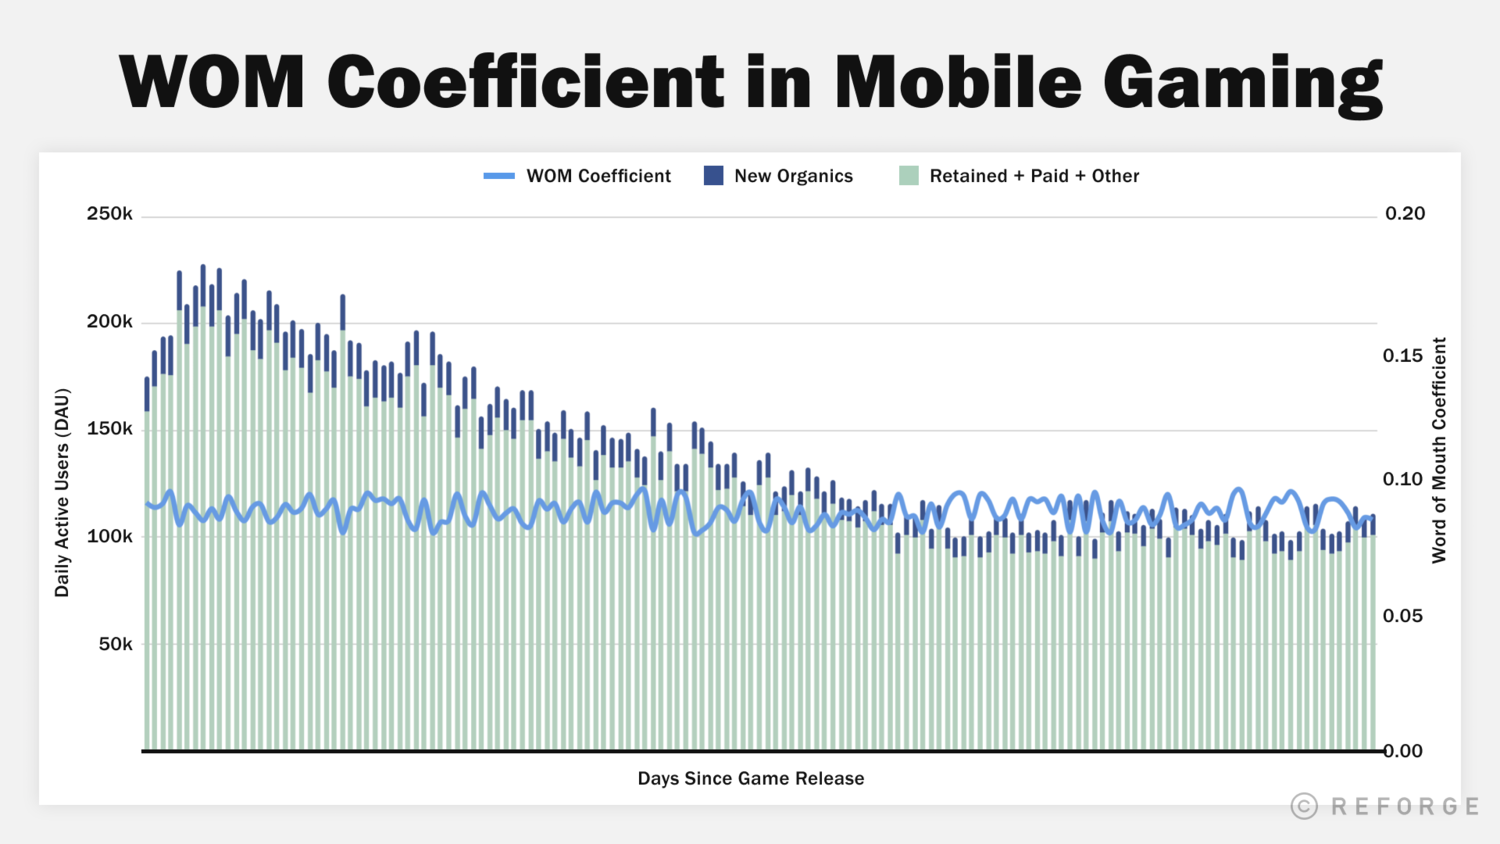
Photo credit: Yousuf Bhaijee
This is a great deep dive into measuring the efficacy of word of mouth. In the article, Yousuf argues that tracking a metric that describes new organic users divided by returning users added to non-organic users will give you the “word of mouth coefficient” and ultimately give you a better understanding of the virality of your product than something like k-factor. It’s an interesting dive into the world of consumer or bottoms-up SaaS metrics and the key factors that drive them.
Thanks for reading, please forward along to friends/colleagues that might be interested in staying in the loop on articles and trends in the operational intelligence space!